If I visualize myself now, I would put it on a timeline history for all my blogging history. I have been blogging since 2009. And since then, blogging was and still is awesome. It feels free to express yourself. Feels great to share information or knowledge with your readers after all those hours you spent on reading books, watching videos and listening to podcasts. If that wasn’t enough, there are also ways to make money out of your blogging routine; ads, affiliate marketing, selling, making, etc.
About mid-last year (2011), I looked through my whole blog posts to see and admire my journal writing work. It’s quite a masterpiece, you might think. But upon looking at my statistics of traffic coming from several sources, it’s not good enough. You might be wondering, “What do you suppose to do to increase traffic to your blog?” The search goes on. Upon research and research, there are a lot of ways to gain more traffic (i.e. Social Media Marketing, SEO, videos and images among the rest of the Internet tactics). Let’s look into one of the ways, i.e. images.
Why use images?
“Let us illustrate our point.” One would say that during a presentation performance. Showing the people a visual diagram of any and many kinds to get the point across can give readers or the audience the feel of information retention. A bigger impact of the information age would be to show the reader (not telling) how a gear works, or how data flows from page to page, or how you put things together like IKEA’s instructions. Graphs, grids, tabular data, picture-by-picture are all forms of showing the information.
And why would we do all of this? Because we care about the reader’s ADD.
Readers have ADD?
That is right. In fact, all of us have ADD (Attention Deficit Disorder). Reason: We do not have a lot of time reading through our RSS feeds or look for another blog to subscribe to fit in their evening reading time. Some of us work and we still read then (through reports, manuals, documents, contracts, etc). So instead of reading, we watch. Watching takes less time to do so. Like a TV show that runs about 15-20 minutes of air time whilst the other 10-15 minutes is the Intro theme, credits and advertisements by the ever gloriously huge television and media industry. So let us add some ADD to our blog posts too.
What kind of Visual Graphics should I use?

Good question. Like I said, there are many kinds of images that you can illustrate your point. You can draw them out on a piece of paper, scan them and post it on your blog. This leads to originality and hopefully goes viral for other people to use the same image. You could try do speed painting over at MS Paint or any other drawing software, then post it. Or even screenshots of sites to show a little in-depth of how you do things or what it looks like on the inside. Let’s look at each of them one by one.
Draw/Sketch it

This is particularly useful for artists with a skill in fine arts. Drawing/sketching or painting all of it and then to share it with the world you can either, scan the art (if it’s an A4 size paper and doesn’t spoil your scanner) or take a picture (or a series of pictures if the art is too big and cannot be scanned like a sculpture). Of course this would depend on your equipment too like, the brightness of your scanner’s lightbulb, the maximum resolution size for a camera, etc.
Design It via Software

There are several software out there that you can use to make your visual graphics. Adobe’s Creative Suite; Illustrator, Photoshop, Indesign; or Microsoft’s MS Paint; or go Open-Source with Inkscape and GIMP. How about web apps if you don’t feel like installing anything with Aviary’s range of web apps? Whatever the means, you can try your graphic design skills out and see what comes up. In my personal opinion, I would like to keep simple and use memes through Ragemaker.net.
Screenshots
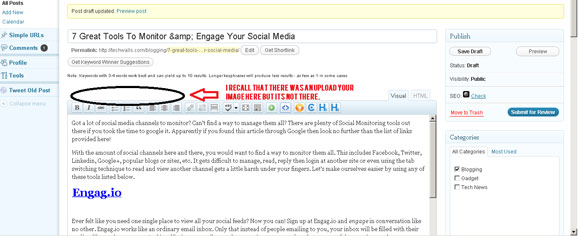
The easiest visual show creating for the less creative individuals is to simply annotate screenshots. Especially useful for those making tutorials or inside looks into web apps or software or solving problems through visual representations like where is the “images” button on WordPress.
In Conclusion
So this is crazy and you just read this article, but take it easy, draw less maybe. That is an advice from me to you. Show with just a few images or one image with less clutter. The point is that you want to show people about a point that you want them to know, i.e. get the reader to focus on the specific part of the image. Everything else is optional.